
Meet Clementine - A 2019 AIHL Prediction Model
Meet Clementine.
Clementine is the third iteration of my AIHL season prediction model that ever July I inevitably decide I'm going to build on a playoff anxiety filled whim.
Her predecessor (lets call him Wesley even though I'm 99% sure I didn’t name him at the time (and if I did I didn’t tweet about it)) was based on soccer single game predictor tutorial that I found on google mid last year, which I have since been unable to locate. Clementine took on a lot of Wesley's code however is literally thousands of times more superior, aka I learnt how to use a Monte-Carlo simulator.
Clementine works by first producing and offensive and defensive ratings for each team, which is calculated by looking at their seasons goals for and against in comparison to the league with a slight adjustment made for a recency bias.
From there we use a poisson distribution model to predict the score between two given teams based on a teams average goals scored, their attack rating, and their defensive rating. The poisson model provides us with 100 potential game scenario from which we can draw our percentages of a team winning (or loosing) and given game.
Now this is where Wesley and Clementine diverge.
Wesley worked by looking at the remainder of the season, and the most likely outcome of each game and telling me what he believed to be the outcome based on these facts. Last year Wesley finished the season with 74% accuracy correctly predicting the winners off of 32 games from a potential 43.
This season however Clementine runs a complete simulation of the remainder of the season over 50,000 times. Recording the W-L-OT record for each team as well as their position at the seasons end, and the given playoff scenarios for each iteration. Then using those numbers she calculates the percentage chance of each available outcome giving us a more complex and accurate prediction.
Now before I let you know about how Clementine feels about the season as it stands I want to thank a couple of people without whom Clementine would be vastly inferior and also probably not exist because I had literally a space of two weeks between the end of the school (teaching) term, and the beginning of my University (Post-Grad) Semester to work this all out if it was ever going to happen. Clementine doesn’t exist without a lot of the people at Hockey-Graphs who after I asked for ‘A dummies guide to running a Monte-Carlo’ willingly obliged with their best links, resources, and background reading. Additionally the biggest of thanks to Tyrell Stokes and Dom Luszczyszyn who talked me through it and let me look at how they ran their own simulators from which I naturally then created something that vaguely resembled potentially the ugly step sisters to their Cinderella. Also to whoever created the football poisson tutorial, I have no idea who you are and I can no longer find the tutorial no matter how hard I try but you're my hero. Thanks.
So what does this all mean for my team.
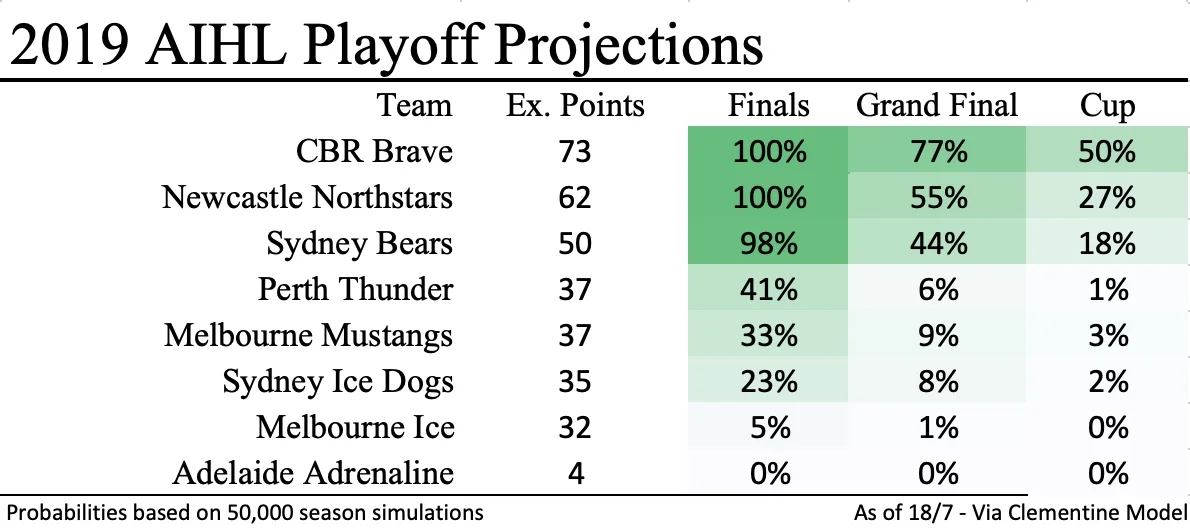
From the 50,000 simulations we received 26 unique playoff scenarios ranging from the somewhat very unlikely (Battle of Sydney Semi Final anyone? There's a 0.005% chance of that happening) to the almost guaranteed (only 5% of simulations have CBR not taking out the minor premiership). The odds however (which I know is what you all scrolled through everything above to read) are attached below, including a point projection detailing where Clementine sees your team most likely finishing in that regard.
A couple of things from above that should be of note:
CBR and Newcastle have both ~statistically~ locked in their trip to finals, CBR of course mathematically clinching last weekend and while Newcastle shouldn’t be too far behind they haven't actually punched their ticket yet. But according to 50,000 simulations its a sure thing that its going to happen soon.
Clementine, like her predecessor Wesley is quite high on the Bears. Last year I said this was weirdly so, but then they went to Melbourne for playoffs and almost beat the record breaking CBR Brave in the fight for the Goodall Cup so maybe Wesley (and now Clementine) just know something I don’t.
Speaking of record breaking she has CBR down as breaking last year's record breaking team points potentially making this year the 4th? Year in a row this has occurred, I have some thoughts about this but frankly I am keeping them to myself.
Clementine also looked at the odds of each team finishing in every position. Which means we can see that battle for the final playoff spot even more clearly. With five teams technically still in it (The Bears obviously have separated themselves out the front, while the Ice have done the same thing at the rear).
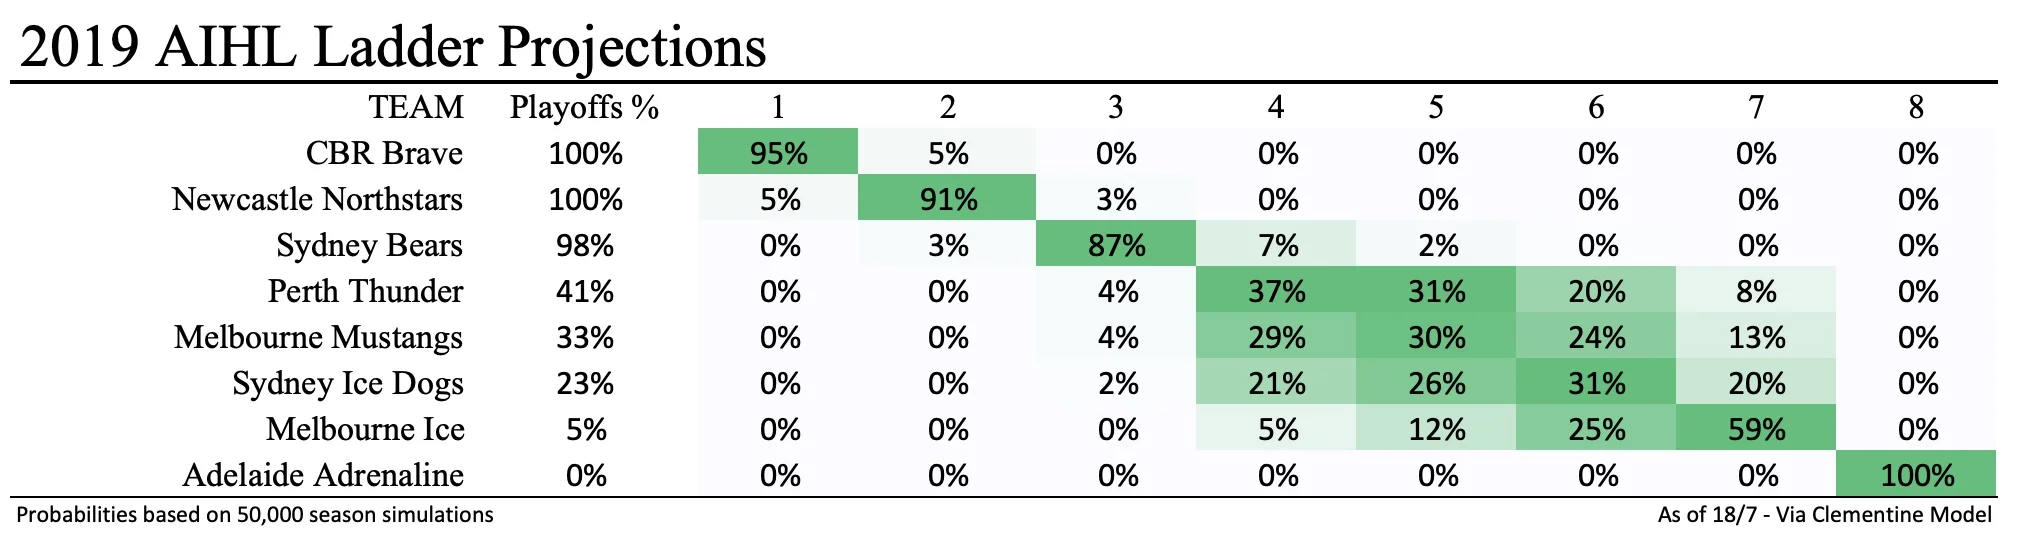
This chart does show that its bad news for Adelaide with last place solidly locked down (all 50000 simulations showed them finishing the season in 8th). There are however some hidden gems in this chart that you can’t actually see because the chance of them happening is so low but Im going to share because they are fun, and I personally enjoyed them.
There was 1 scenario where CBR finished as low as 3rd in the regular season.
From CBR down to the Ice Dogs every team in the top six had at least 3 scenarios where they finished in 2nd.
The Sydney Bears is the only team outside of CBR and Newcastle to have Clementine place them at the top of the table and it only happened in 1 scenario
As mentioned above Adelaide finished last in every single simulation, and for that I am sorry
For those wanting to follow Clementine along for the rest of the season I will be posting updates on my twitter (@alyssastweeting) as well as some fun other tidbits such as points spread predictions and clinching scenarios.